https://<your-org>.app.credibledata.com) is where your team consumes published semantic models. Everything happens inside workspaces — shared spaces scoped to a set of packages and members.
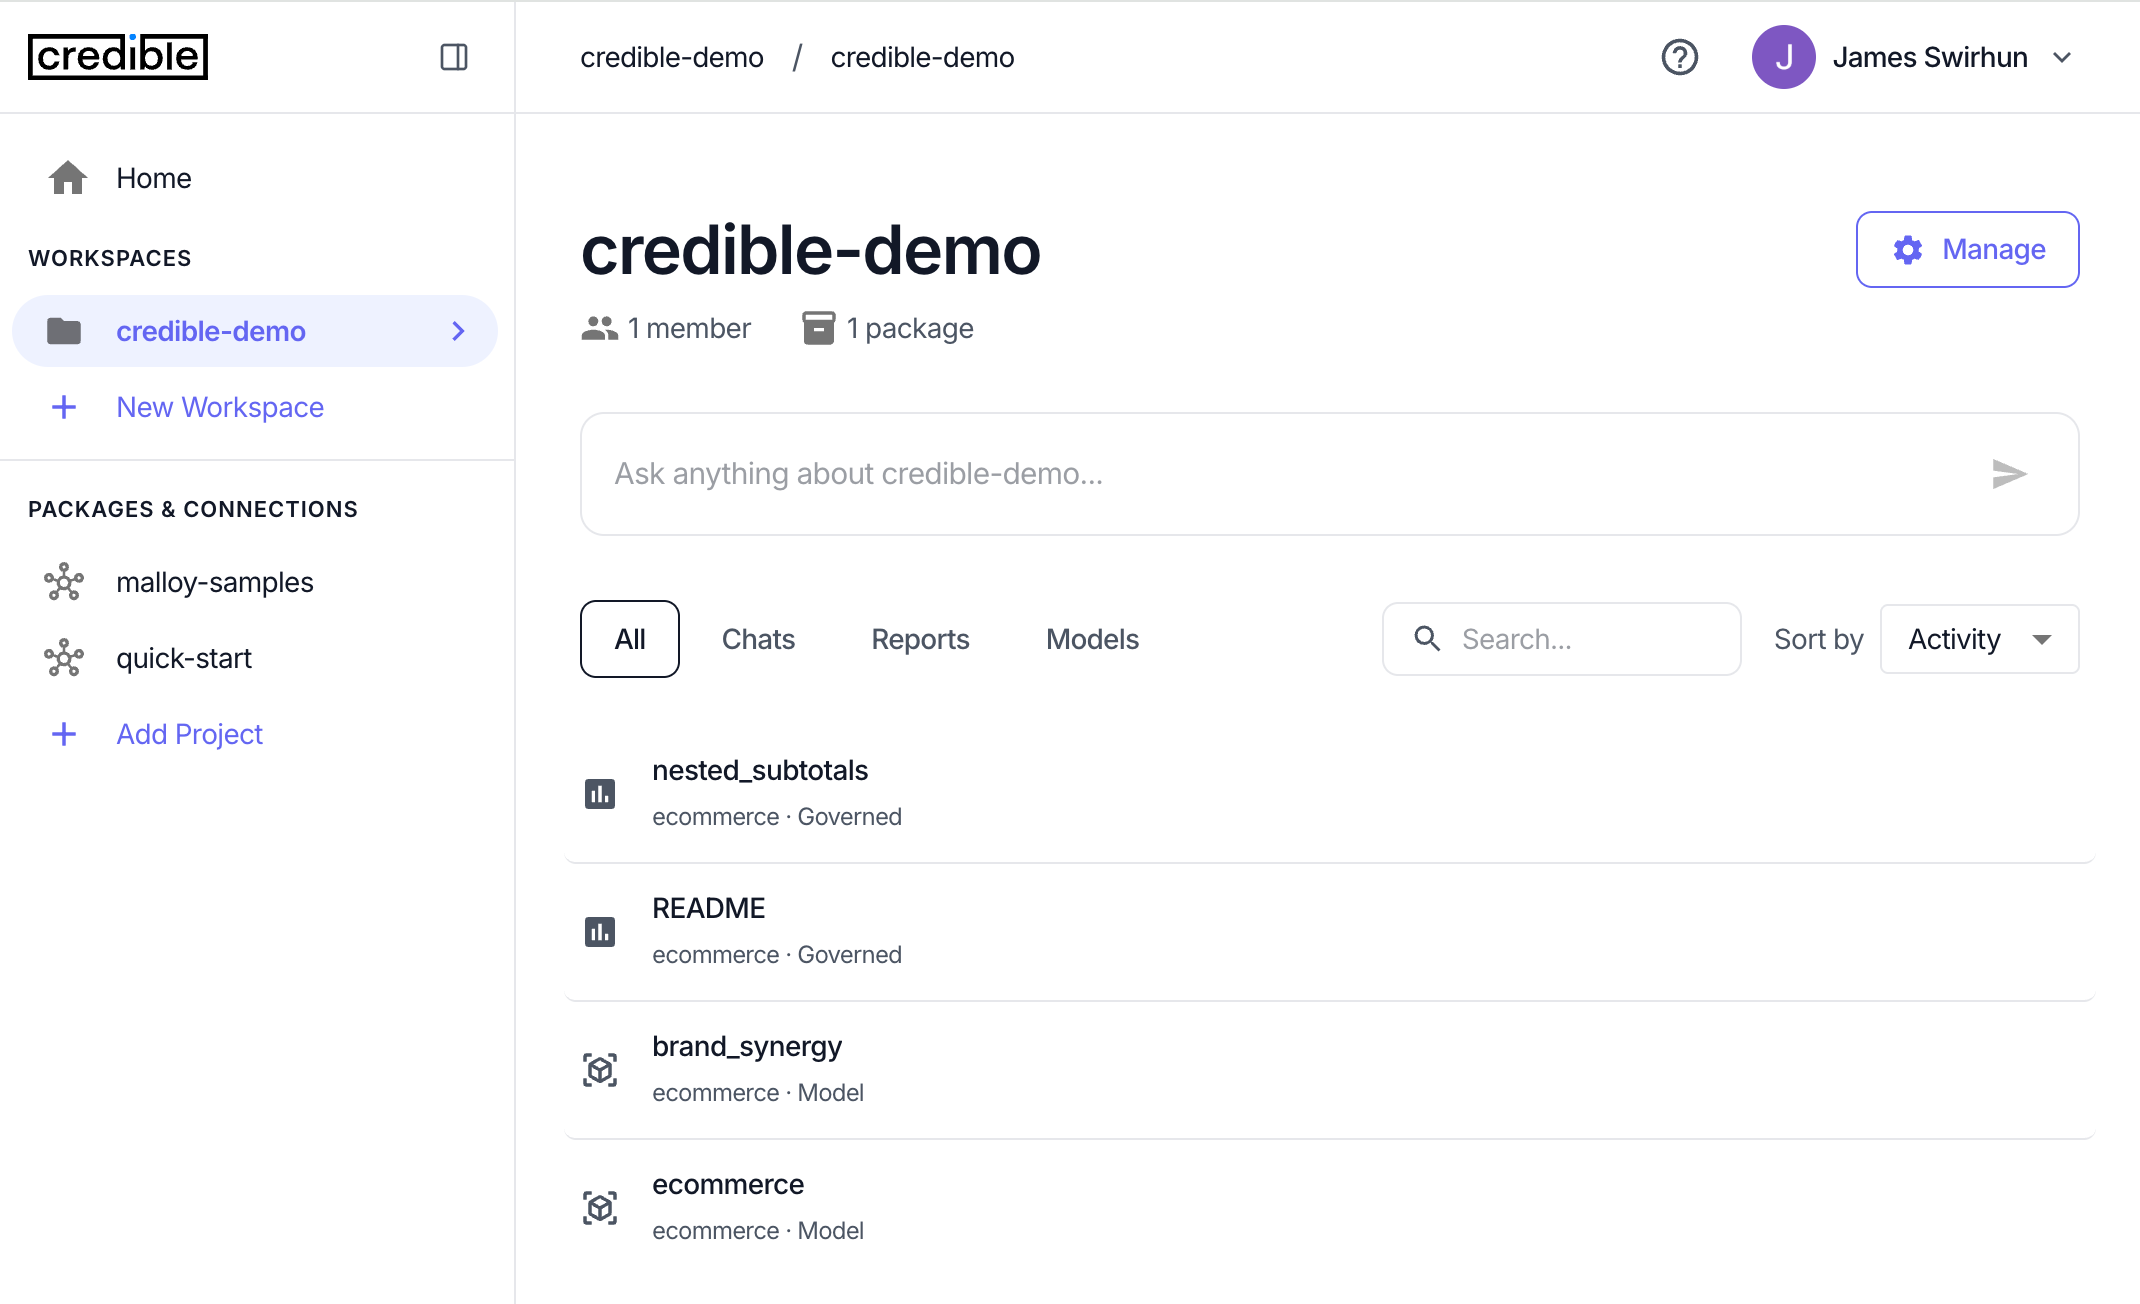
Chat
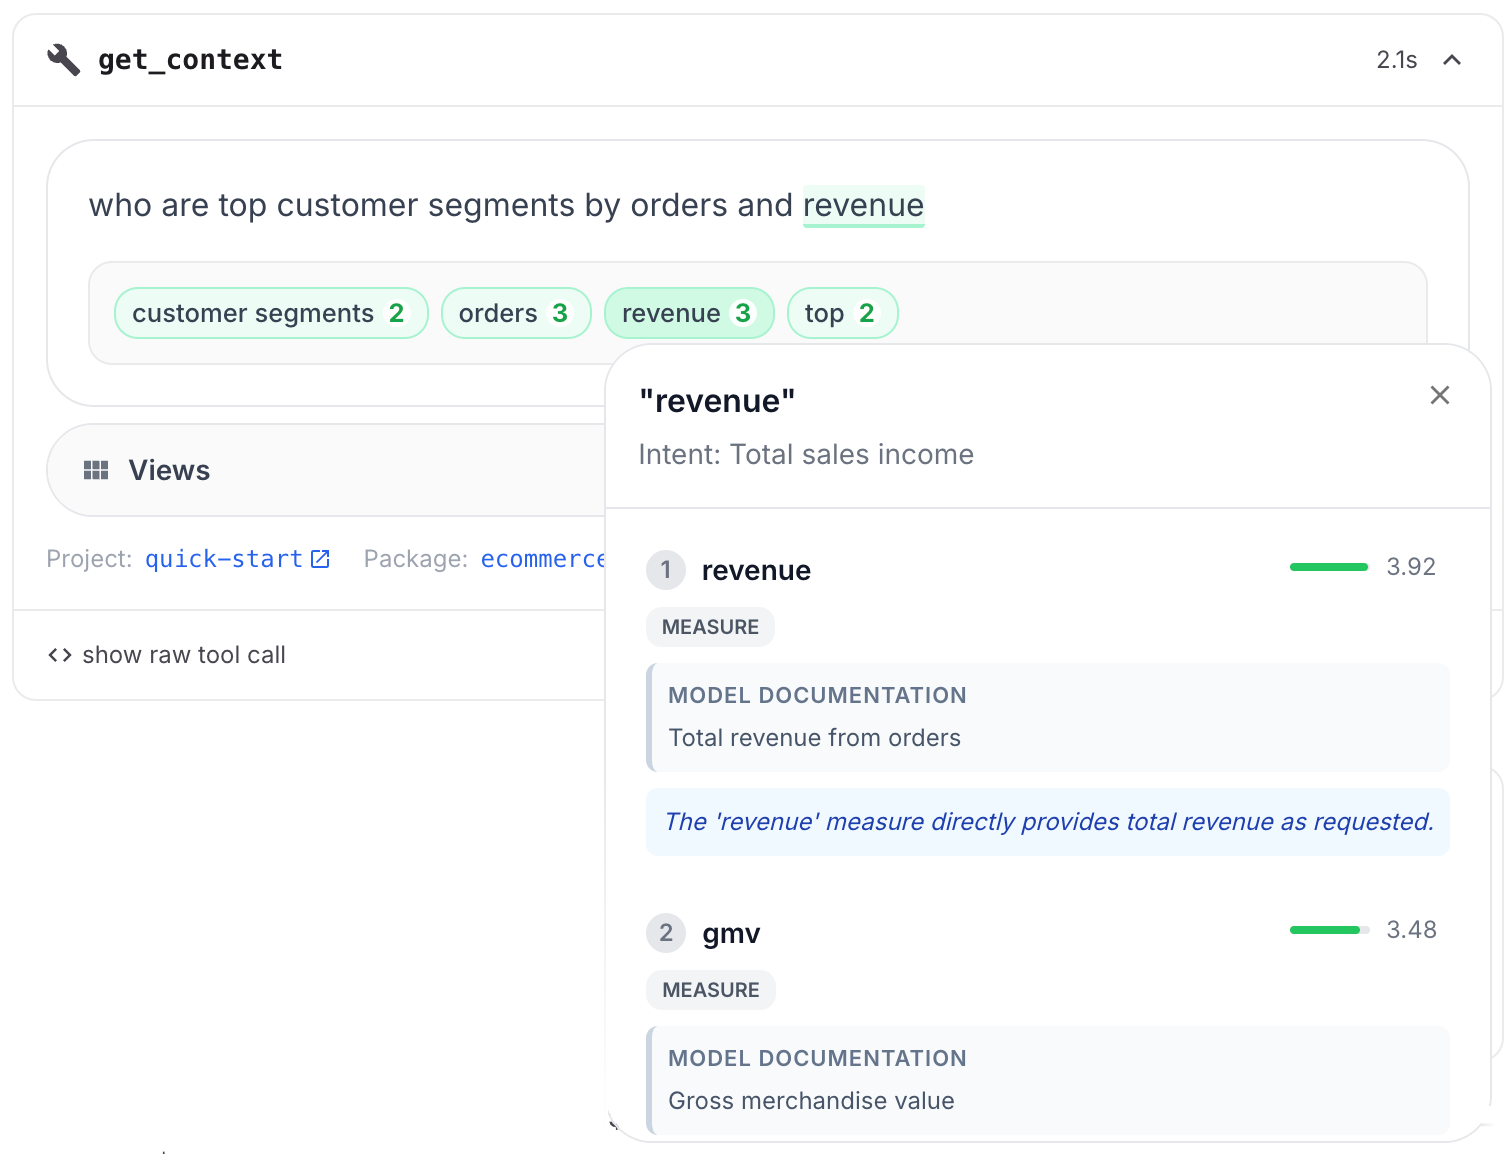
Type a question in the chat bar at the top of any workspace. The Credible Context Engine parses your question into phrases, matches each phrase to governed entities (dimensions, measures, views) in your semantic model using#(doc) and #(index_values) annotations, and the agent executes a trustworthy Malloy query against your data.
How it works
get_context— Parses your question into semantic phrases and matches them to data entities declared in your published models. Match quality depends on the#(doc)descriptions and#(index_values)annotations in your model.execute_query— The agent constructs and runs a Malloy query using the matched entities, returning results and visualizations.
Published models must be indexed before chat works. Check for a green “Indexed” tag on the package page.
Reports
There are two kinds of reports in a workspace:- Governed reports —
.malloynbnotebooks published with a package. These are versioned, reviewed, and part of the governed model. They appear under the Reports tab automatically. - Ad-hoc reports — Created from a chat conversation. These are based on the governed model but are not part of the published package. Save any chat analysis as a report to share it with workspace members.
.malloynb notebooks.
Explorer
The Models tab lets you browse semantic models available in the workspace. Click on a model to open it in the Explorer — a visual, no-code query builder where you can select dimensions, measures, and views, build queries, and visualize results as charts and tables. This is useful for understanding what data is available before starting a chat, or for hands-on exploration of your models. See the Explorer documentation for a full guide to the interface.Notebooks
Malloy notebooks (.malloynb files) published with a package appear as reports in the workspace. They blend markdown, Malloy queries, and visualizations into interactive documents — useful for data stories, KPI dashboards, and package overviews.
A README.malloynb at the package root automatically renders on the package landing page.
Getting Started
- Publish and index a model — See Publishing
- Create a workspace — Add packages and members in the Credible App
- Ask a question — Type a question in the workspace chat bar
#(doc) descriptions and #(index_values) annotations — see Metadata Tags.
See Also
- Quick Start — End-to-end tutorial including workspace chat
- Credible Context Engine — How phrase-matching and entity retrieval work
- MCP Reference — Technical details on
get_contextandexecute_query - Credible App Admin — Creating and managing workspaces